- First, open your Google Analytics report.
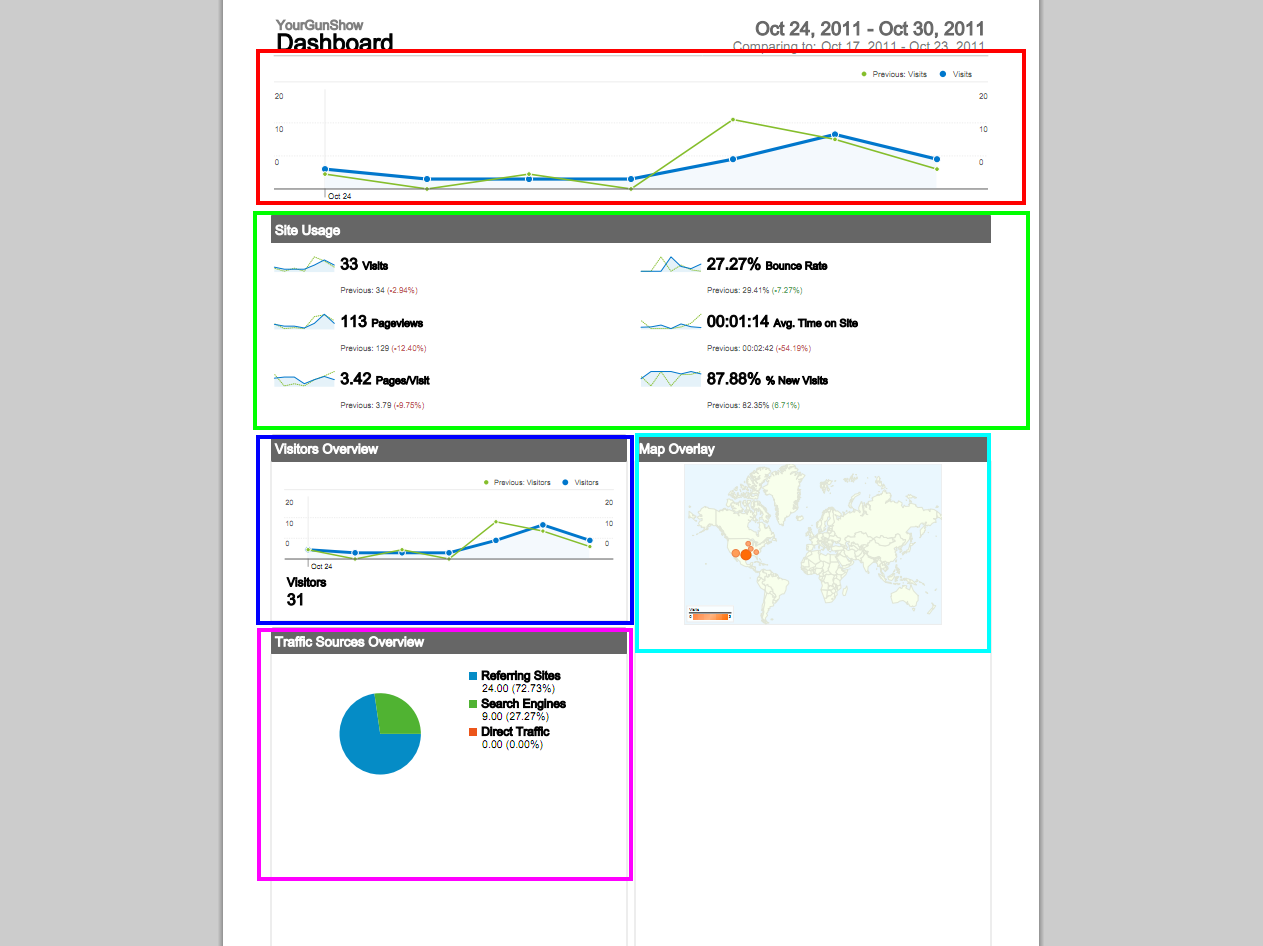
- The first page will show an overview of all statistics.
- The red box displays the number of users in comparison to the previous week.
- The Green box shows various statistics involved with viewer activity.
- The Blue box shows the number of “Unique” users, (i.e. this does not include people who view the site multiple times.
- The teal box shows the geographical locations of visitors.
- The purple box shows how people got to the site.
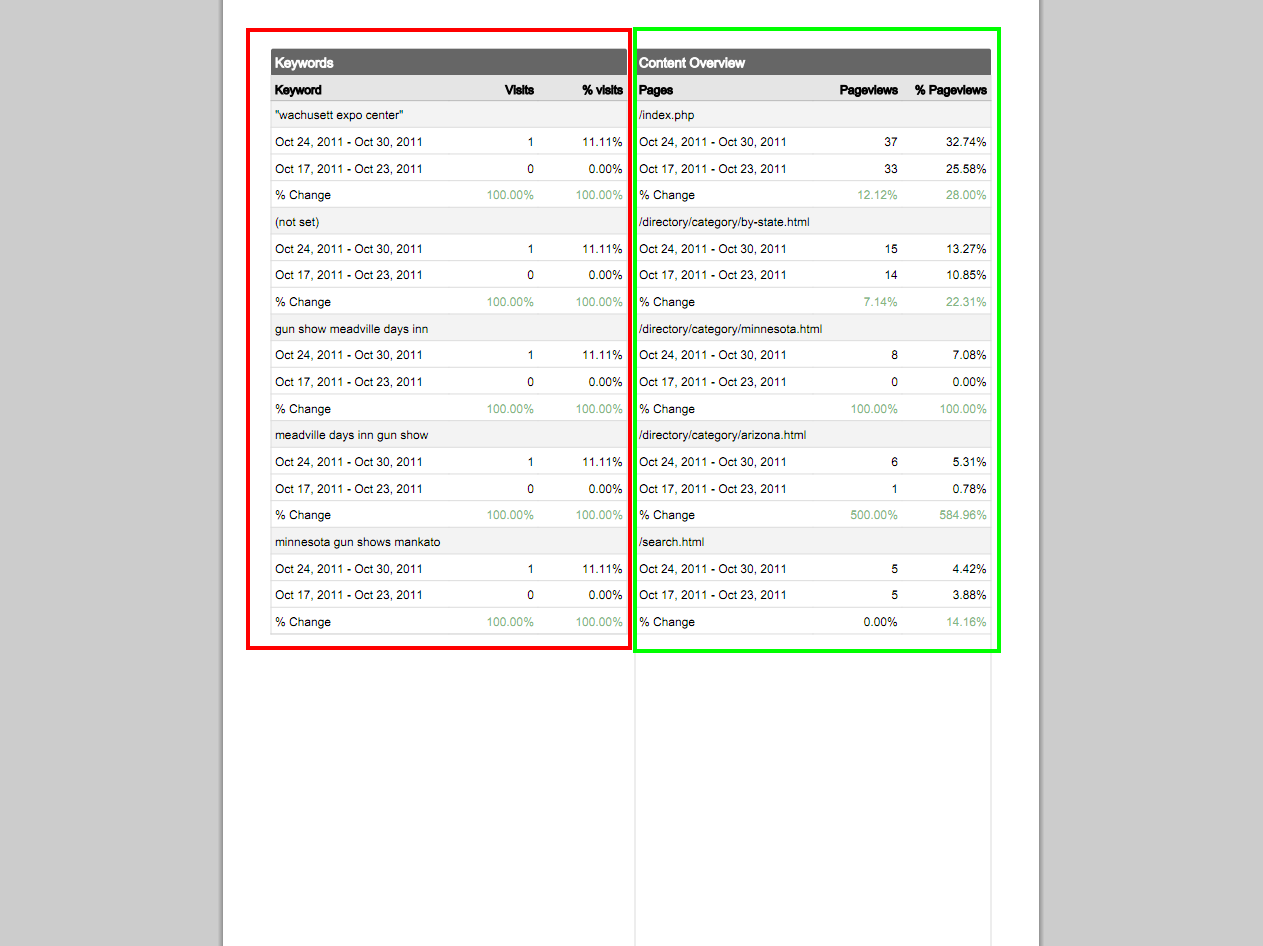
- The red box shows what people searched for, and how they got to your site with it.
- The Green box shows the most popular pages on your website.
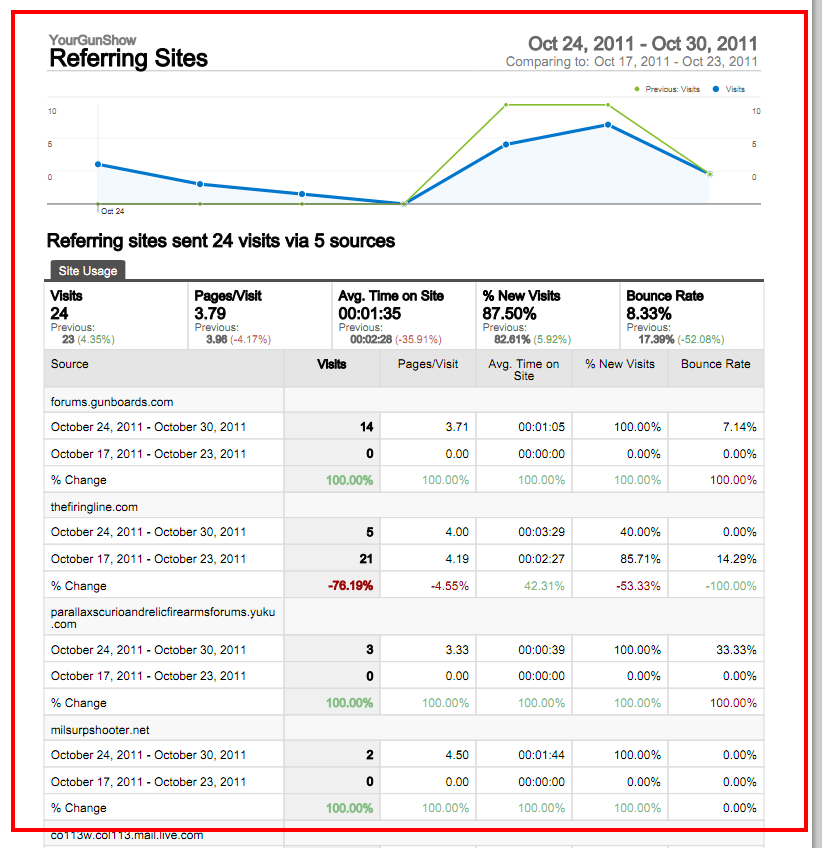
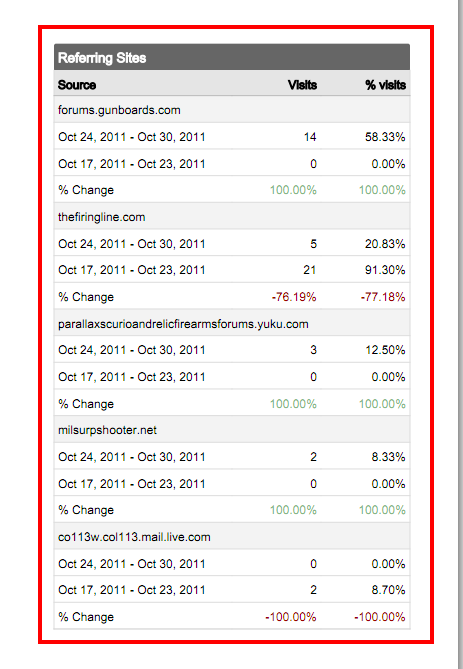
- The referring sites page shows what other sites people accessed your site from through links.
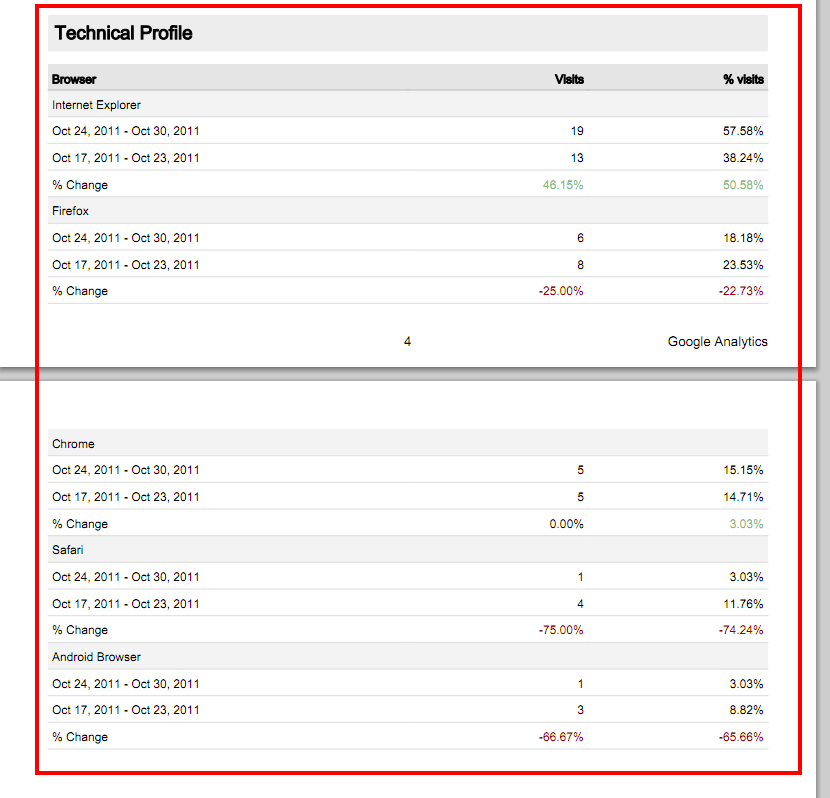
- The Technical Profile shows which web browsers were used to view your site, and how many times they were used.
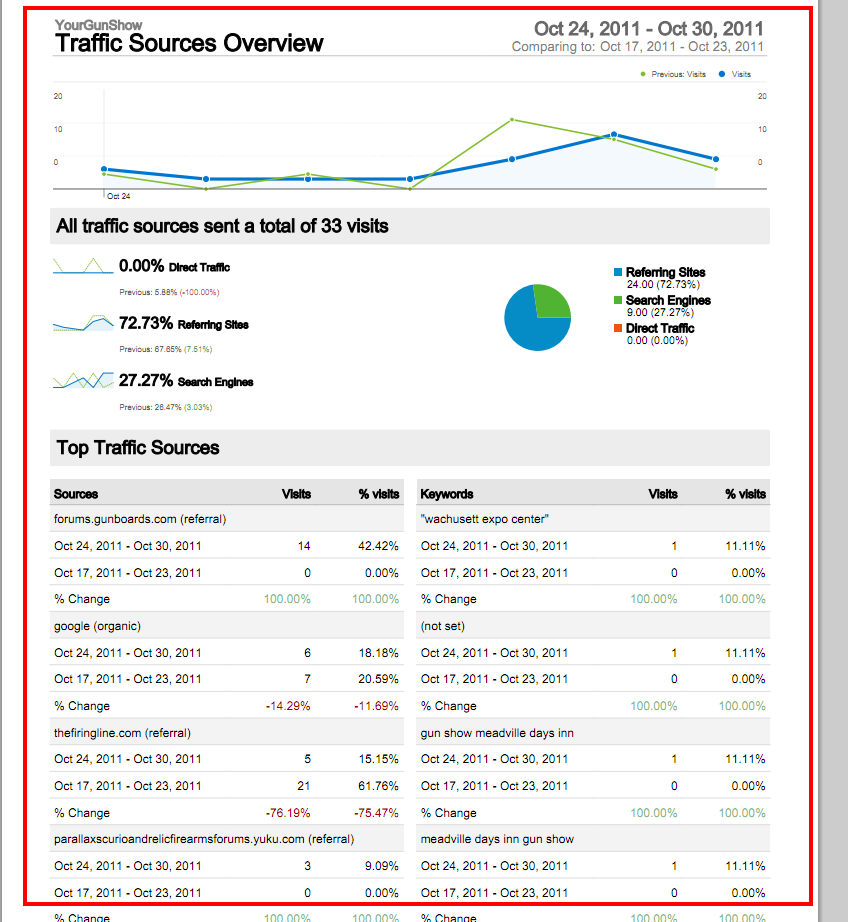
- The Traffic Source Overview gives an in-depth overview of what links and other websites people accessed your website from.
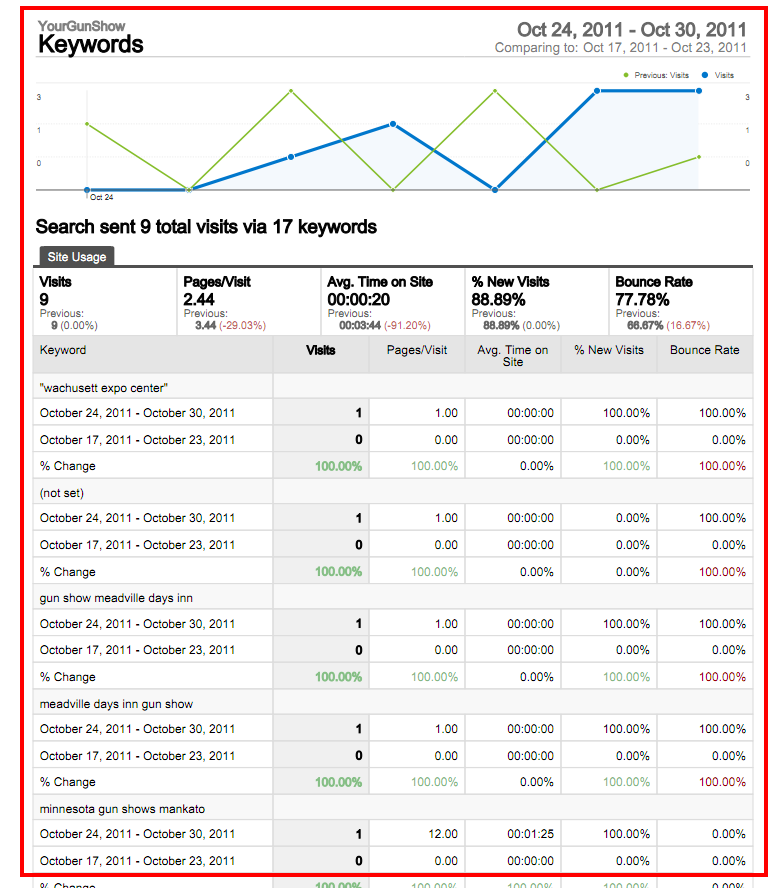
- Keywords shows how many people came to your website by using key word search terms. It also shows how many of them were new visitors, and how long they stayed on the website.
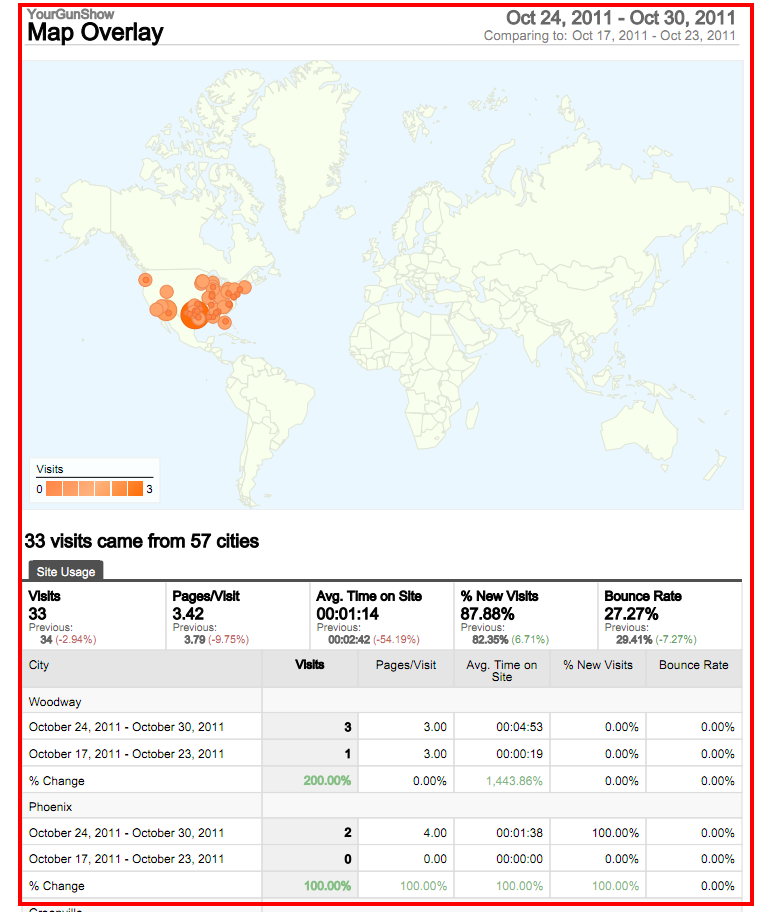
- The Map Overlay shows what regions viewed your website, as well as cities where users accessed it from.
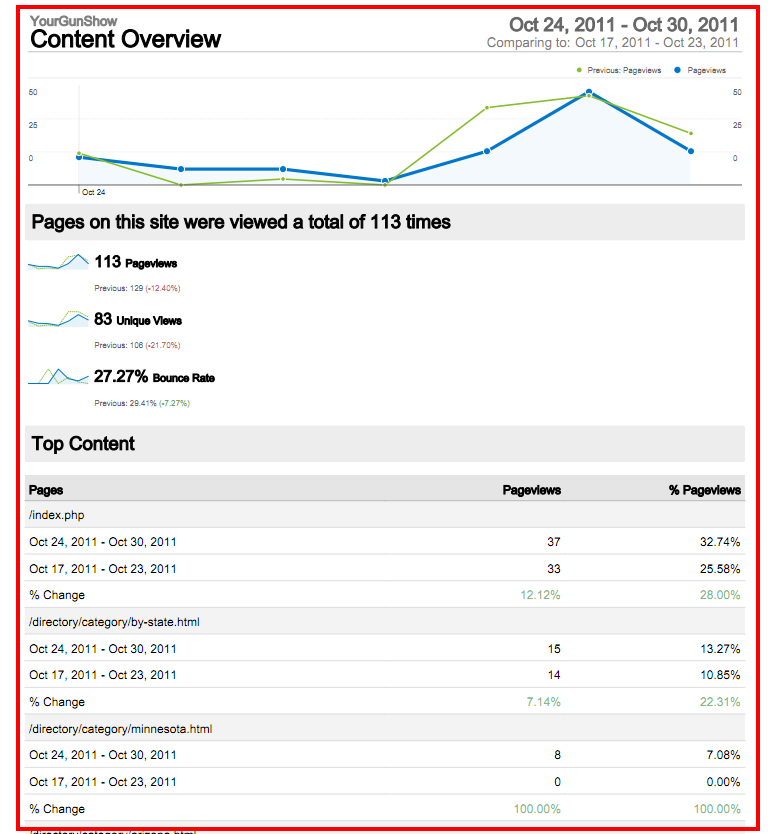
- The content overview is an in-depth look at the most popular pages viewed during the time period.
- The referring sites page is like the traffic sources page, but only focuses on links from other websites.